Excel is a powerful spreadsheet software that offers a wide range of features and tools to analyse and manipulate data. One such tool that can significantly streamline data analysis is the Quick Analysis tool Excel. In this article, we will explore the Quick Analysis Tool, its functionality, and how it can help users efficiently analyse data, make informed decisions, and save valuable time in Excel.
Understanding the Quick Analysis Tool:
The Quick Analysis Tool is a feature available in Microsoft Excel that provides users with a quick and visual summary of data, allowing them to analyse patterns, trends, and relationships without the need for complex formulas or manual calculations. It offers a variety of analysis options and formatting suggestions that can be applied to selected data with just a few clicks.
Key Features and Functionality:
Data Visualization: The Quick Analysis Tool offers various chart options, including column charts, pie charts, line charts, and more, allowing users to visually represent their data for better understanding and insights. Users can select the data range, choose a chart type, and instantly create a visually appealing chart.

Phuong Cool
33 posts
Warning: Undefined array key "language" in /www/wwwroot/yoosight.com/assets/includes/functions_three.php on line 1879
Deprecated: strtolower(): Passing null to parameter #1 ($string) of type string is deprecated in /www/wwwroot/yoosight.com/assets/includes/functions_three.php on line 1879
-
 Investigation Reveals Feasibility Issues for Britain's AI Growth Zones
An investigation finds Britain's AI growth zone plans are facing feasibility issues, with land shortages and renewable energy goals unmet.
-
 AI Drafting Tools Alter Public Perception on Sensitive Issues
AI drafting tools can alter user posts on sensitive topics like abortion and climate change, potentially reshaping public opinion over time.
-
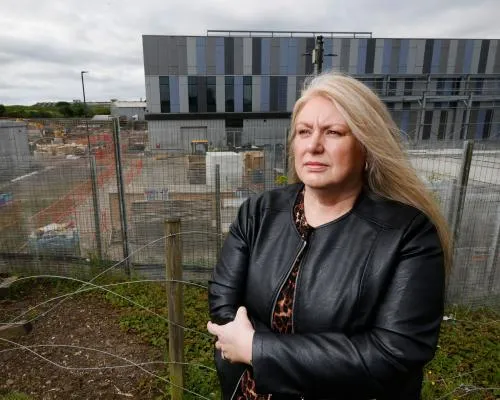 Concerns Grow in Scottish Village over AI Datacentre Project
Local residents in Newarthill fear their properties may be sold or green spaces lost as part of an AI datacentre project. Government promises about renewable energy sources are disputed.
-
 Công nghệ chip trong bóng Trionda phát hiện va chạm đến mức nào
Chi tiết về công nghệ bóng Trionda trong World Cup 2026, cách hệ thống cảm biến quán tính IMU phát hiện va chạm chính xác hơn 100 lần mỗi giây.
-
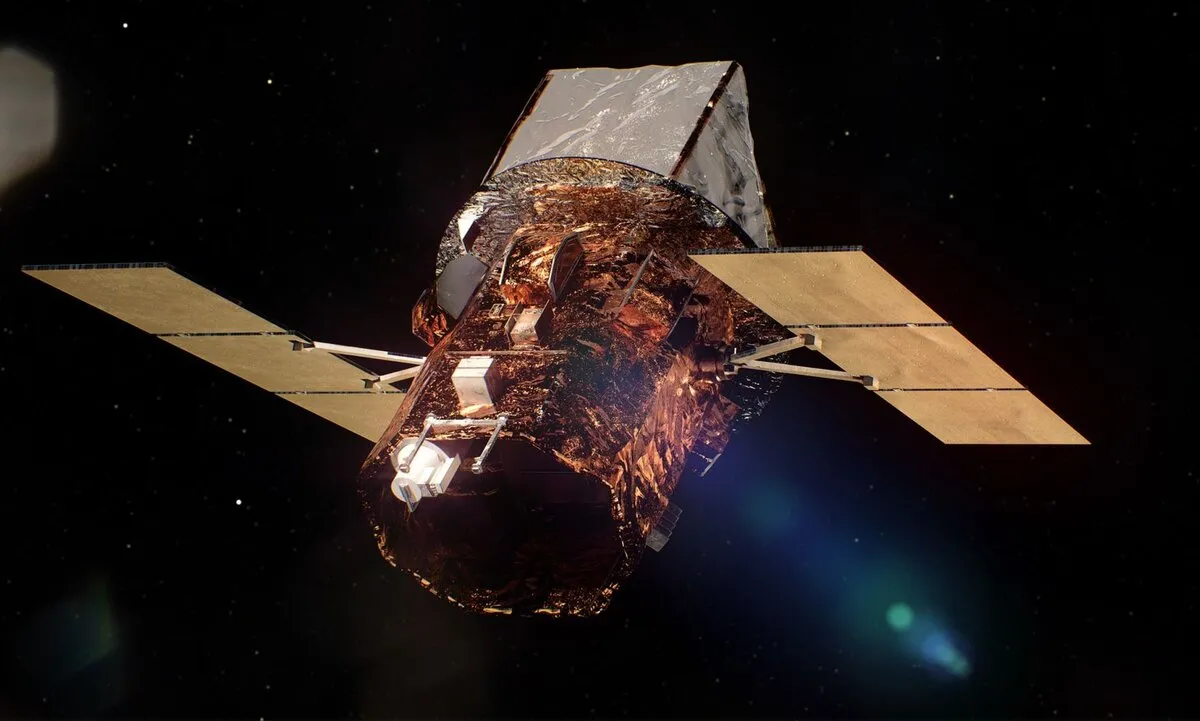 NASA triển khai robot cứu kính viễn vọngSwift trị giá 250 triệu USD
NASA triển khai robot để cứu kính viễn vọngSwift trị giá 250 triệu USD, đặt ra phương án tương lai cho hoạt động tương tự.
-
 Elon Musk's Social Media Focus on UK Race and Immigration Overshadows SpaceX IPO
An analysis of Elon Musk’s X posts reveals that he focused more on UK race and immigration during SpaceX’s IPO run-up than his own company.
-
 Mark Zuckerberg: CEO công nghệ với đam mê chăn nuôi 'thịt bò tốt nhất thế giới'
CEO Meta Mark Zuckerberg đầu tư vào dự án chăn nuôi để tạo ra loại thịt bò chất lượng cao nhất thế giới.
-
 UK’s Stargate UK Datacentre Project: A Hyped but Hypothetical Investment
The Stargate UK datacentre project appears to be a largely hypothetical investment, with key partners failing to visit the proposed site. Local leaders question its feasibility and authenticity.
-
 Cảm biến bóng xác định việt vị: Thế nào để quyết định chính xác?
FIFA sử dụng cảm biến tích hợp trong quả bóng để xác định tình huống việt vị và đưa ra quyết định chính xác.
-
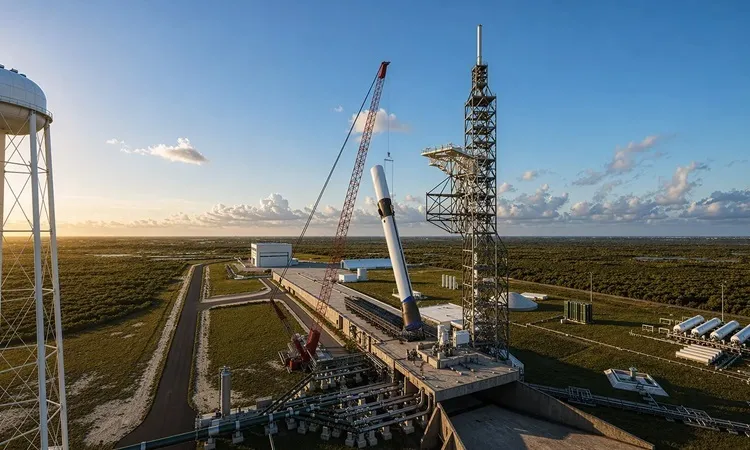 Blue Origin tái cấu hình phóng sau vụ nổ New Glenn
Blue Origin chuyển cấu hình phóng sau vụ nổ New Glenn để tăng tần suất bay.
-
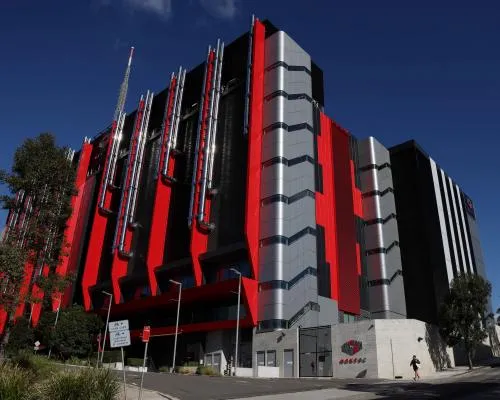 OpenAI's Sydney Office: NSW Government's Hesitation Amid AI Dystopia Fears
NSW government's cautious approach to OpenAI's Sydney office, balancing enthusiasm with environmental concerns.


