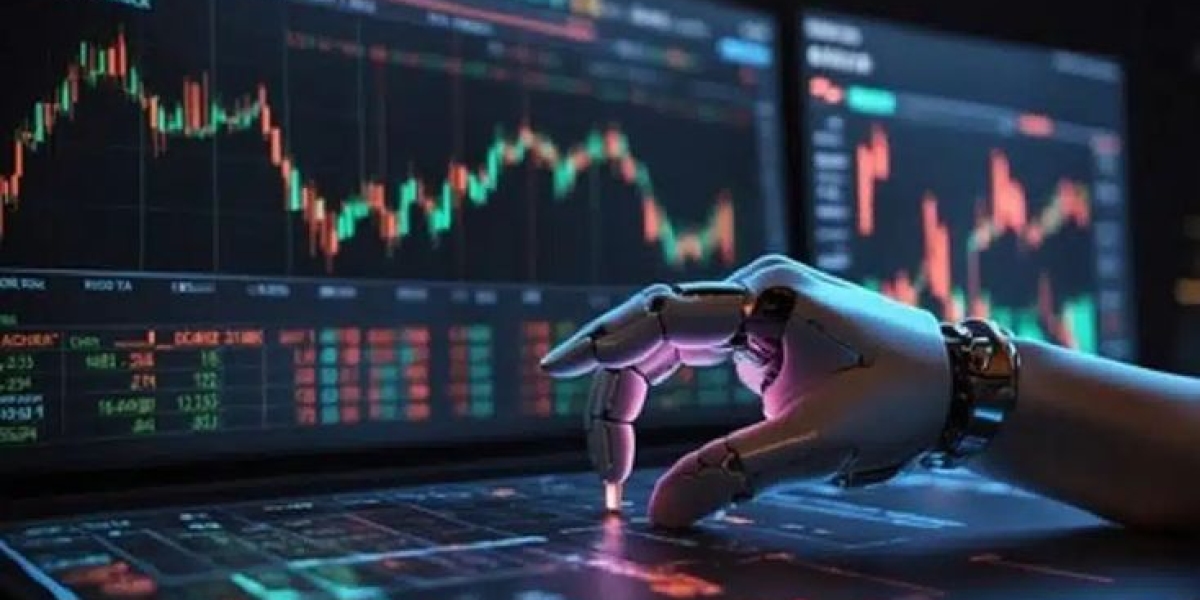
Best Trading App in India for Candlestick Chart Analysis
In the dynamic world of online trading, mastering the art of reading charts can set a trader apart from the crowd. Among the most powerful tools for analyzing price movements, candlestick chart analysis stands as a favorite among professional and retail investors alike. For those looking to build strong trading strategies based on patterns and trends, selecting the best trading app in India for candlestick chart analysis becomes crucial. With the right platform, traders can visualize market sentiment, identify reversals, and make informed entry and exit decisions.
Understanding Candlestick Chart Analysis
Candlestick charts are visual representations of price movements within a specific time frame. Each candlestick shows four data points: the open, high, low, and close prices. By studying these patterns, traders can interpret market behavior, predict reversals, and identify continuation trends.
Originally developed in Japan over 200 years ago, this method remains one of the most reliable tools in technical analysis today. Patterns like Doji, Hammer, Shooting Star, and Engulfing give traders deep insight into market psychology and momentum.
For Indian traders, apps that offer advanced candlestick charting tools, customizable indicators, and real-time analysis can significantly enhance performance.
Why Candlestick Charts Are Essential for Modern Traders
The appeal of candlestick charts lies in their ability to convey complex market information in a visually intuitive manner. Unlike bar or line charts, candlesticks combine data precision with interpretive power.
Here are key advantages of using candlestick analysis:
Visual Clarity: Easy to interpret bullish and bearish signals.
Pattern Recognition: Helps identify reversal and continuation formations.
Multi-Timeframe Flexibility: Works effectively across intraday and long-term charts.
Emotional Insight: Reflects market psychology and trader sentiment.
Combinational Use: Integrates well with other indicators like RSI, MACD, and Bollinger Bands.
For traders who rely on technical analysis, these benefits can make the difference between reactive and predictive trading.
Key Features to Look for in a Candlestick Chart Best Trading App in India
Before selecting the best trading app in India, consider these essential features:
1. Advanced Charting Interface
A powerful charting engine with smooth zooming, panning, and multi-timeframe viewing is critical for accurate candlestick interpretation.
2. Customizable Indicators
The ability to overlay indicators such as Moving Averages, RSI, or Fibonacci retracements enhances pattern confirmation.
3. Multiple Timeframes

A top-tier app allows traders to switch between 1-minute, 5-minute, hourly, daily, and weekly charts to understand price movements across time scales.
4. Drawing Tools and Annotations
Support for trendlines, support/resistance zones, and notes help traders mark and monitor critical price levels.
5. Real-Time Market Data
Candlestick accuracy depends on live market feeds. Choose an app that provides zero-latency updates for precision-based trading.
6. Multi-Device Accessibility
Synchronization between mobile, desktop, and web platforms ensures consistent data and analysis on the go.
7. User-Friendly Interface
While technical sophistication is important, ease of use matters equally for seamless trade execution.
Benefits of Using Candlestick Analysis in Trading
Using candlestick charts as a primary analytical tool can elevate a trader’s understanding of the market.
Improved Timing: Enables precise identification of trend reversals.
Risk Management: Candlestick formations help set accurate stop-loss levels.
Pattern Recognition: Identifies bullish/bearish engulfing, Morning Star, and Doji formations easily.
Combination Strategies: Integrates with moving averages and oscillators for confluence-based decision-making.
Market Versatility: Effective across equities, commodities, currencies, and indices.
With practice, candlestick interpretation becomes second nature, empowering traders to act decisively in volatile markets.
Top Trading Apps in India for Candlestick Chart Analysis
Let’s explore some of the most reliable and technically advanced apps that help traders master candlestick analysis.
1. Zerodha Kite
Zerodha’s Kite platform, integrated with TradingView and ChartIQ, is a powerhouse for chart lovers. It provides over 100 indicators, multiple timeframes, and intuitive candlestick visualization. Traders can use pattern overlays and compare scripts easily.
2. Upstox Pro
Upstox Pro offers professional-grade charting with multiple candlestick options, drawing tools, and real-time market data. It’s perfect for traders focusing on intraday and swing strategies.
3. Angel One App
Angel One’s SmartAPI and ARQ Prime features enhance analytical depth. The app provides robust candlestick views with AI-driven insights, making it ideal for beginners and advanced users alike.
4. Dhan
Dhan offers TradingView integration with seamless candlestick charting, pattern recognition tools, and low-latency order execution. It’s designed for traders who prefer precision and performance.
5. Fyers Markets
Fyers provides TradingView-powered charts with full-screen mode, multi-chart layouts, and numerous candlestick pattern tools. The app’s focus on visualization makes it stand out among analytical traders.
6. Groww
Initially a mutual fund platform, Groww now supports equity and derivative trading. Its clean interface and basic candlestick charting make it suitable for beginners looking to learn technical analysis.
7. 5paisa
5paisa combines affordability with advanced charting features. It offers real-time data, technical indicators, and a user-friendly interface—perfect for traders seeking both cost-effectiveness and functionality.
How to Use Candlestick Charts Effectively
Even with the best tools, success depends on skillful interpretation. Here’s how to enhance your candlestick trading strategy:
Identify Key Patterns: Recognize fundamental patterns such as Doji, Hammer, or Engulfing before entering trades.
Combine with Indicators: Use Moving Averages or RSI for trend confirmation.
Observe Volume: Confirm pattern strength through volume spikes.
Use Multiple Timeframes: Analyze higher and lower timeframes to validate setups.
Set Entry and Exit Points: Candlestick confirmation helps set precise entry, stop-loss, and target levels.
Mastering these techniques allows traders to trade confidently, especially in volatile markets.
Advantages of Real-Time Candlestick Analysis
In fast-moving markets, real-time chart updates are essential for executing timely trades. Apps offering instant data streaming provide an edge by helping traders catch early breakouts and avoid false signals.
Other advantages include:
Quick Decision-Making: React immediately to price action.
Reduced Slippage: Fast updates help minimize trade delays.
Higher Profit Potential: Early trend identification improves profitability.
For day traders and scalpers, real-time candlestick data can be the difference between profit and loss.
Common Mistakes to Avoid in Candlestick Analysis
Even seasoned traders can misread candlestick formations if they ignore context. Here are frequent pitfalls:
Relying on single candlestick signals without confirming indicators.
Ignoring market trends and macroeconomic news.
Using too many indicators simultaneously, leading to confusion.
Failing to account for volume while interpreting patterns.
By avoiding these mistakes, traders can sharpen accuracy and build consistent trading discipline.
Future of Candlestick Charting and Mobile Trading
As mobile trading continues to dominate, the demand for sophisticated, user-friendly charting tools is on the rise. AI-based chart pattern recognition, voice-enabled trading, and customizable strategies are shaping the next generation of trading apps.
Upcoming trends include:
AI Pattern Detection: Automatic identification of candlestick setups.
Cloud Synchronization: Real-time sync between devices.
Integrated Strategy Builders: Create and test automated candlestick strategies.
Predictive Analytics: AI-driven forecasting for advanced decision-making.
The fusion of AI and technical analysis is redefining how traders interact with charts and execute trades.
Final Thoughts
For traders aiming to master price action, having the right tools is non-negotiable. A platform that provides accurate candlestick visualization, analytical flexibility, and real-time execution ensures a smooth and profitable trading experience. The best trading app in India for candlestick chart analysis not only enhances technical understanding but also supports faster, data-driven decision-making.
And while advanced features are vital, traders should also focus on cost efficiency. Understanding the lowest brokerage charges in India ensures that your profits aren’t eroded by high fees. Choosing a platform that offers a blend of robust charting tools and affordable pricing creates the perfect balance between analytical strength and financial prudence, empowering traders to navigate every market scenario with confidence and precision.
TheBestStockBroker
6 posts
-
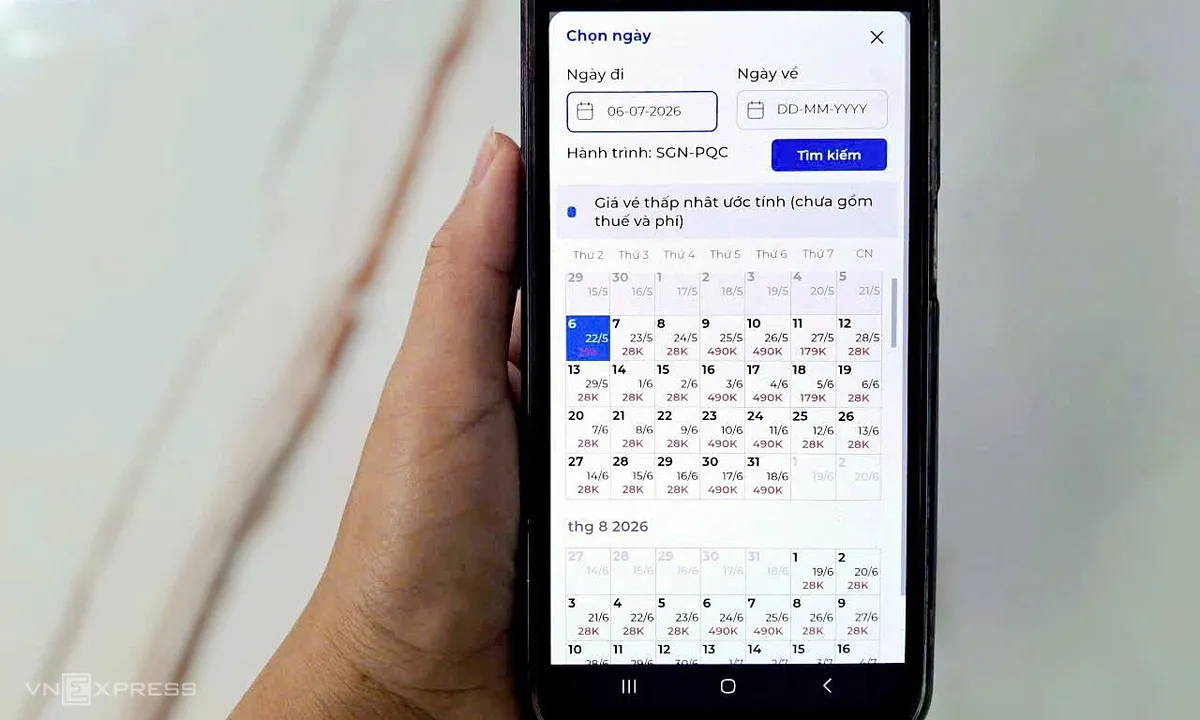
Hàng không đua giảm giá vé hè chỉ từ 28.000 đồngDựa trên khảo sát của VnExpress, nhiều hãng hàng không đã tung ra vé máy bay nội địa với mức giá chỉ vài chục nghìn đồng để kích cầu. Điều này có thể tạo nên sự thay đổi lớn trong hành trình du lịch hè của người dân.
-

Chuyên gia: Doanh nghiệp nhỏ vẫn chủ yếu dùng mạng xã hội trong chuyển đổi sốBáo cáo từ hội thảo về thúc đẩy ứng dụng công nghệ số cho thấy chuyển đổi số trong doanh nghiệp nhỏ ở Việt Nam mới chỉ dừng lại ở mức 'phần ngọn', với tập trung chủ yếu vào mạng xã hội, còn nhiều vấn đ?
-

UK Housing Market Shows Signs of Recovery; FTSE Shares and Oil Prices ReactUK house prices show a slight recovery in June, while FTSE All-Share performances and oil prices react to global events.
-
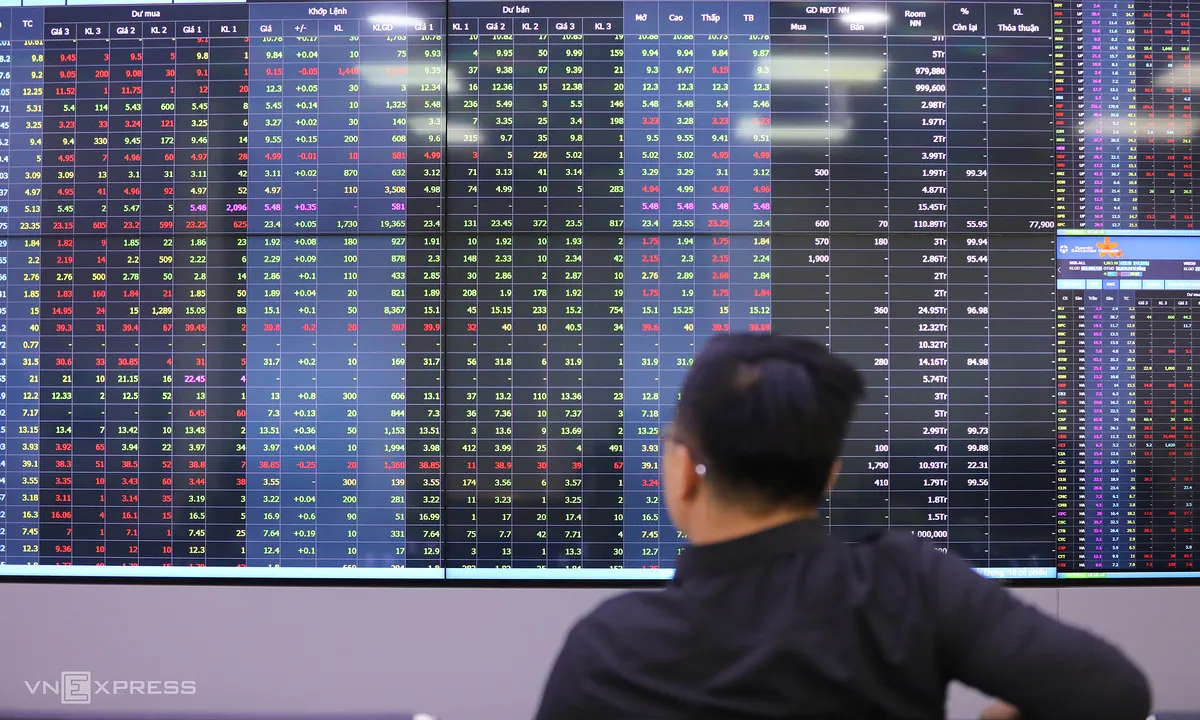
85% doanh nghiệp môi giới chứng khoán cạnh tranh 'miếng bánh' chia nhỏThị trường môi giới chứng khoán TP HCM đang chia nhỏ hơn bao giờ hết, với doanh nghiệp đầu ngành mất đi gần 3 điểm phần trăm. SSI và VPBankS có động thái đáng chú ý trong quý II.
-

Major Business Moves Shape UK and Global MarketsMajor corporate deals and policy shifts this week include Sky's acquisition of ITV media assets, Microsoft's job cuts amid AI investments, and the UK launch of a new Wegovy weight-loss pill.
-

EasyJet Shares Soar After US Private Equity Firm Agrees £5.5bn TakeovereasyJet shares soar after agreeing to a £5.5 billion takeover bid by US private equity firm Castlelake, sparking discussions on undervalued UK firms.
-
ITV Sells Broadcasting Division to Sky: An Era EndsITV sells its broadcasting division to Sky for £1.6 billion, marking an end to 70 years of free-to-air commercial broadcasting.
-
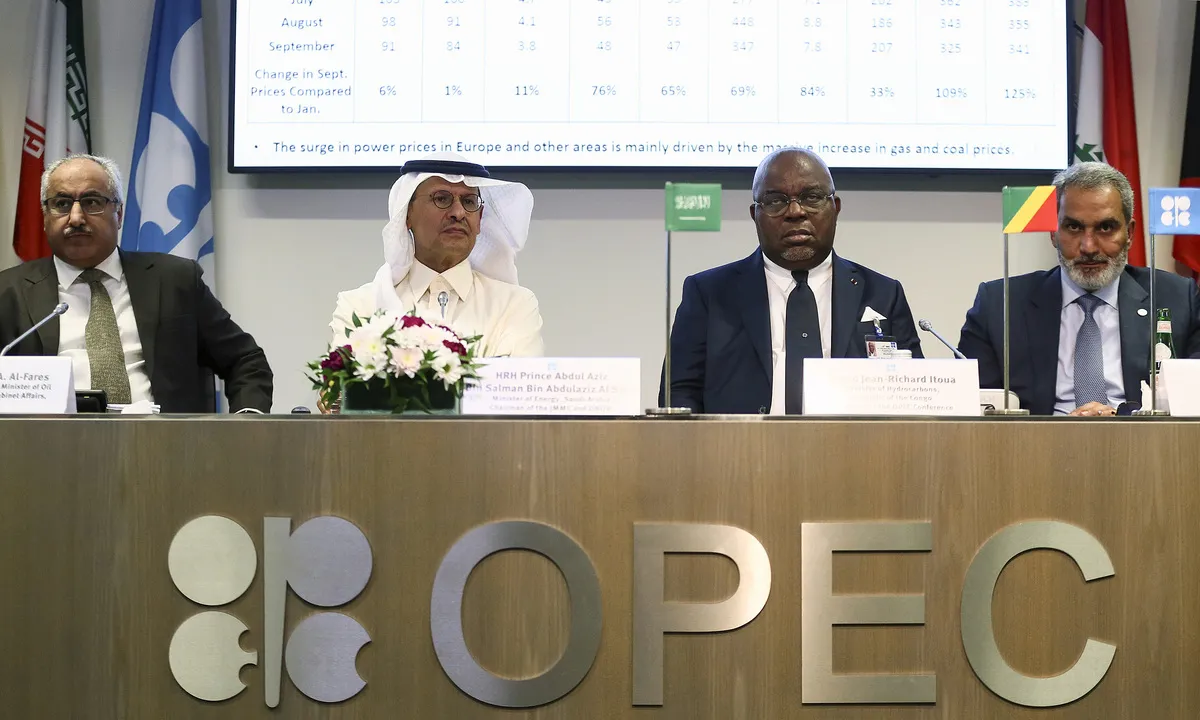
OPEC+ tăng sản xuất dầu tháng thứ 5 liên tiếp: Tầm ảnh hưởng của chiến sự Trung ĐôngBài viết phân tích quyết định của OPEC+ trong việc tiếp tục tăng sản lượng dầu sau khi gặp phải nhiều thách thức từ chiến sự ở Trung Đông, cũng như tác động đến giá cả trên thị trường.
-

Anthony Kasozi: A Leadership Coach Who Empowered Through Difficult ConversationsAnthony Kasozi was a leadership coach who specialized in helping clients build their confidence. He worked with numerous organizations and founded his consultancy Quilibra Consulting.
-
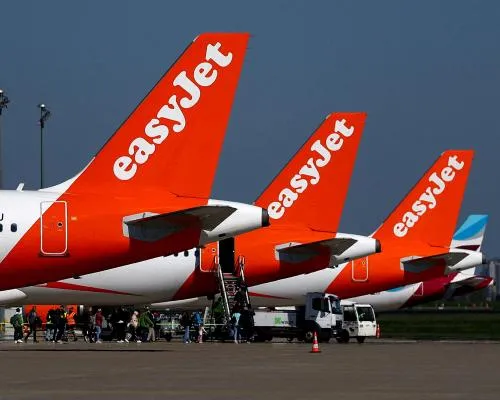
EasyJet Sees £5.5bn Takeover by US FirmeasyJet agrees to a £5.5 billion takeover by US investment firm Castlelake, signaling a major change for Britain's largest low-cost carrier.
-
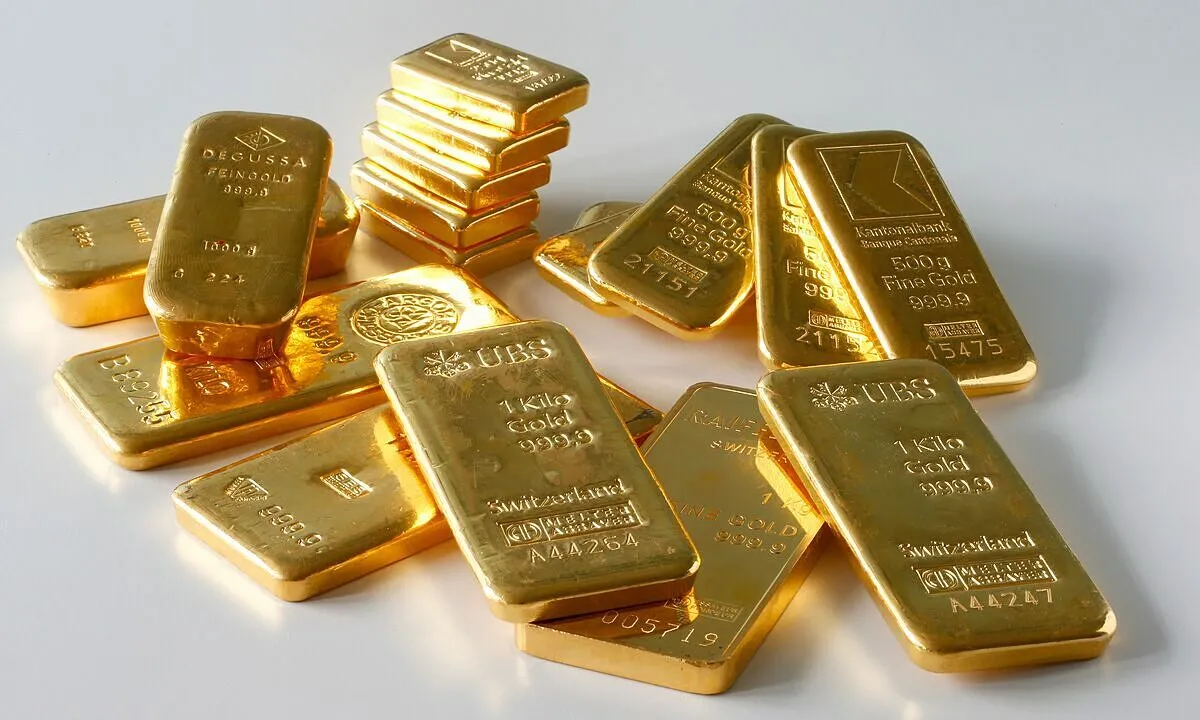
Giá vàng dự kiến tăng sau giảm giá 3 thángÁp lực lãi suất giảm và các ngân hàng trung ương tiếp tục mua vào hỗ trợ giá vàng. Chuyên gia dự báo biến động kỹ thuật của hợp đồng vàng giao tháng 8 đang hình thành.


